
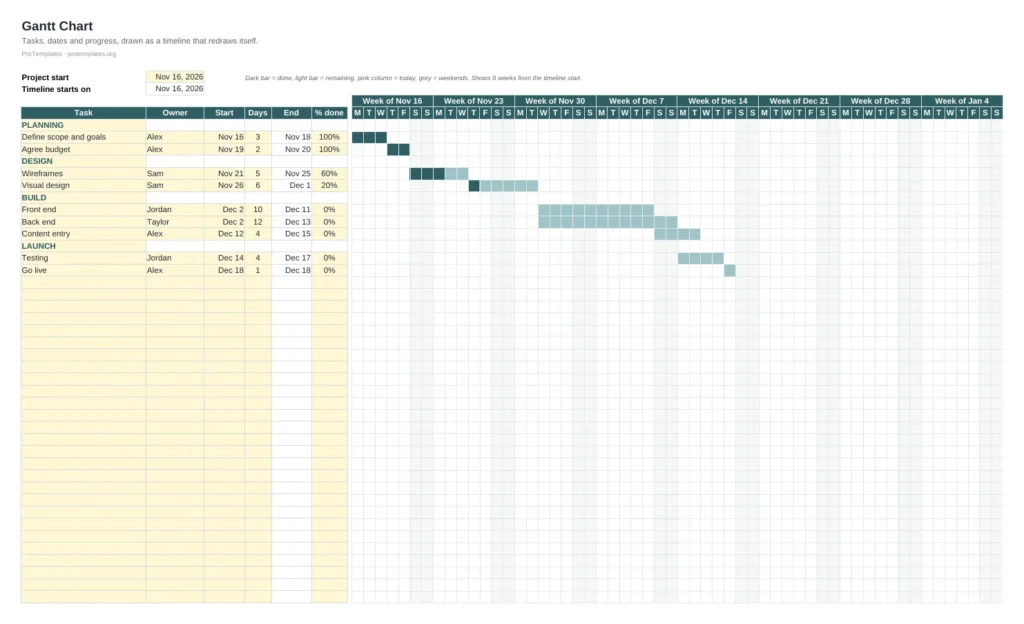
What’s inside
- Task list with owner, start date, days, end date and % done
- Eight-week daily timeline with week headers
- Progress shading inside each bar
- Today and weekend highlighting
- Section rows to group phases
How to use it
- Set the project start date.
- List tasks with owners, start dates and durations.
- Link dependent tasks by setting a start date to the end of another task plus one.
- Update % done as work progresses.
FAQ
Does it use macros?
No. The bars are conditional formatting, so the file opens safely in Excel and Google Sheets.
Can I show more than eight weeks?
Yes. Copy the last timeline columns to the right; the formatting rules follow the same pattern.
Are weekends counted in durations?
Yes, durations are calendar days. For working days only, add the weekend days to each duration.

