What’s inside
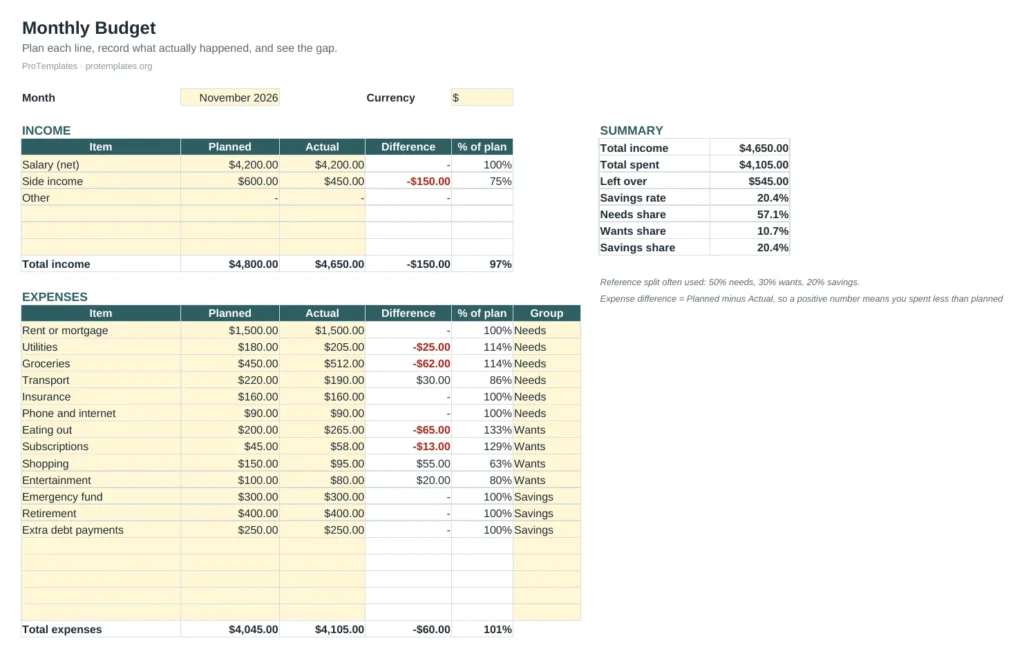
- Monthly Budget tab with planned, actual and difference for every income and expense line
- Needs, Wants and Savings groups with a live 50/30/20 comparison
- Savings rate and money left over, calculated for you
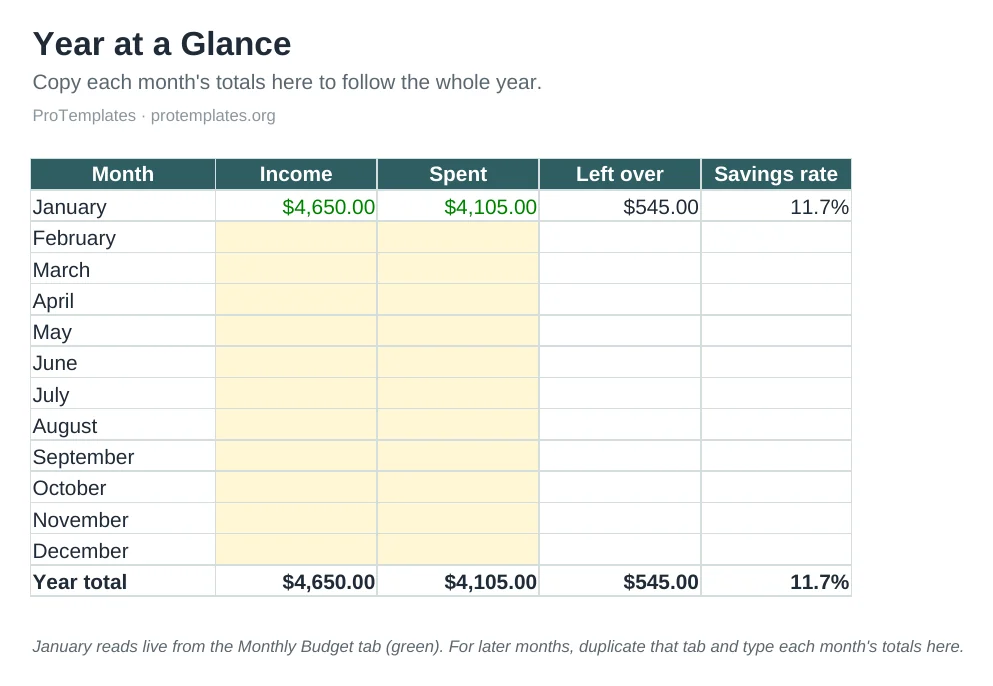
- Year at a Glance tab with one line per month
- A How to use tab and example rows you can overwrite
How to use it
- Open the file in Google Drive (or File > Import in Google Sheets).
- Set the month and list your income sources with planned and actual amounts.
- Add each spending line and pick its group: Needs, Wants or Savings.
- Check the Summary box and the red figures to see where you went over.
- Copy each month’s totals into Year at a Glance.
FAQ
Does it work in Excel too?
Yes. The file is a standard .xlsx, so it opens in Excel, Google Sheets, LibreOffice and Numbers without losing formulas.
What does the 50/30/20 split mean here?
It is a common rule of thumb: about half of take-home pay on needs, 30% on wants and 20% on savings or extra debt payments. The template shows your real split so you can compare, not a target you must hit.
Why is the difference positive when I spend less?
For expenses the sheet shows planned minus actual, so a positive number means money saved against plan. Income works the other way round, and anything that hurts your budget turns red.
Can I track several months?
Duplicate the Monthly Budget tab for each month and type each month’s totals into Year at a Glance, which already reads January live.