
To make a budget in Google Sheets, create one tab to log every transaction with a date, category and amount, and a second tab that lists your categories with a planned amount, an actual amount for the month calculated with SUMIFS and the difference. Add a drop-down for categories so the totals always match.
Plan the structure before you type
Most homemade budgets fail because everything goes on one sheet, and within a month it is a wall of numbers. Split it in two from the start:
- Transactions: one row per payment or income, logged as it happens.
- Budget: one row per category, with the plan, the actual and the gap.
The Consumer Financial Protection Bureau’s budgeting worksheets follow the same logic: record what you actually spend this month, then use it to plan next month. A spreadsheet just does the adding up for you.
Step 1: Build the Transactions tab
Rename the first tab Transactions and add five headers: Date, Description, Category, Type (Income or Expense) and Amount. Format the Date column as a date and the Amount column as currency. Enter amounts as positive numbers; the Type column tells the sheet which side they belong on.
Step 2: Create a category list
Add a third tab called Lists with your categories in column A: Rent, Groceries, Utilities, Transport, Eating out, Subscriptions, Savings and so on. Twelve to fifteen categories is plenty. Fewer categories means less time deciding where things go.
Step 3: Add a drop-down to the Category column
Select the Category column on Transactions, open Data, then Data validation, and choose Dropdown (from a range) pointing at the list on the Lists tab. Now every transaction uses exactly the same spelling, which matters because the totals in the next step match text exactly.
Step 4: Build the Budget tab with SUMIFS
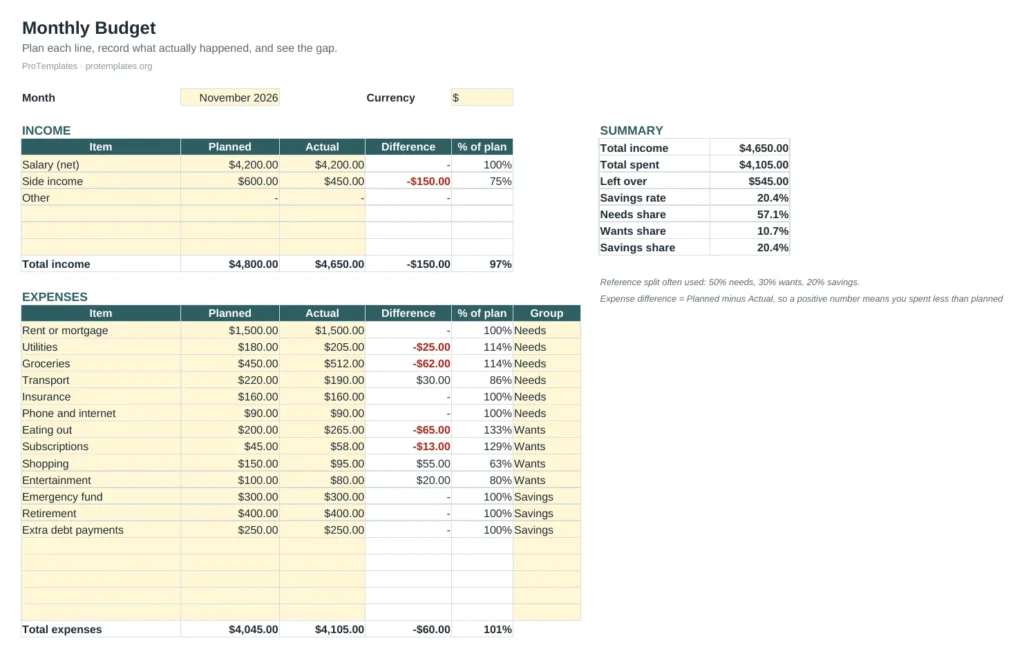
Create a tab called Budget with four columns: Category, Planned, Actual and Difference. List the same categories in column A and type your planned amount for each in column B. Type Month in E1 and the first day of the month you are budgeting in F1, for example 1/11/2026. In C2, total the actual spending for that category in that month with SUMIFS:
=SUMIFS(Transactions!E:E, Transactions!C:C, A2, Transactions!A:A, ">="&$F$1, Transactions!A:A, "<="&EOMONTH($F$1, 0))
SUMIFS adds up the Amount column on Transactions only for rows that match the category in A2 and whose date falls between the first and the last day of the month in F1. EOMONTH returns that last day. Google’s documentation gives the syntax as SUMIFS(sum_range, criteria_range1, criterion1, …), with the column to add first. Copy the formula down, then put =B2-C2 in the Difference column. A positive number means you spent less than planned.
Step 5: Add a summary box
Above or beside the table, add four cells that answer the questions you actually care about:
- Total income:
=SUMIFS(Transactions!E:E, Transactions!D:D, "Income", Transactions!A:A, ">="&$F$1, Transactions!A:A, "<="&EOMONTH($F$1, 0)) - Total spending:
=SUMIFS(Transactions!E:E, Transactions!D:D, "Expense", Transactions!A:A, ">="&$F$1, Transactions!A:A, "<="&EOMONTH($F$1, 0)) - Left over: income minus spending.
- Savings rate: left over divided by income, formatted as a percentage.
Step 6: Make problems visible
Select the Difference column, open Format, then Conditional formatting, and colour cells red when they are less than zero. Overspent categories now stand out without you having to read every number. If you follow the 50/30/20 split (needs, wants, savings), add a Group column to the Budget tab and total each group with SUMIF the same way.
Step 7: Run it month to month
Two habits keep a spreadsheet budget working. First, log transactions at least weekly, from your bank app or statements, so the actual figures are never more than a few days old. Second, at month end, duplicate the Budget tab, rename it with the new month and change the date in F1. Keep logging on the same Transactions tab: each Budget tab only counts its own month, so the totals stay correct. Your old months become a history you can compare against, which is where the real insights come from.
Or start from a template
Building it yourself teaches you how the numbers connect. If you would rather start budgeting today, the template below has all of this done, plus a Year at a Glance tab and the 50/30/20 comparison.
Free Budget Template for Google Sheets
Planned, actual and difference for every line, a summary box with savings rate, and a yearly view. Opens in Google Sheets or Excel.
Prefer to plan the whole year at once? The annual budget template works the same way across twelve months, and there are more options in our budget templates collection.
FAQ
Does Google Sheets have a built-in budget template?
Yes, the template gallery includes monthly and annual budget templates. They are a reasonable start, but most people outgrow them because the categories and layout are fixed.
Should I use SUMIF or SUMIFS?
SUMIF handles one condition. A monthly budget needs more than one, because each total has to match the category and fall inside the month, so this guide uses SUMIFS. That way a single Transactions tab can hold the whole year.
Can I import transactions from my bank?
Most banks let you download a CSV file. Import it with File, then Import, map the columns to your Transactions tab and add the categories yourself.
How often should I update the budget?
Weekly is enough for most people. Daily logging is more accurate but harder to keep up, and a budget you abandon in February is no use to anyone.