
What’s inside
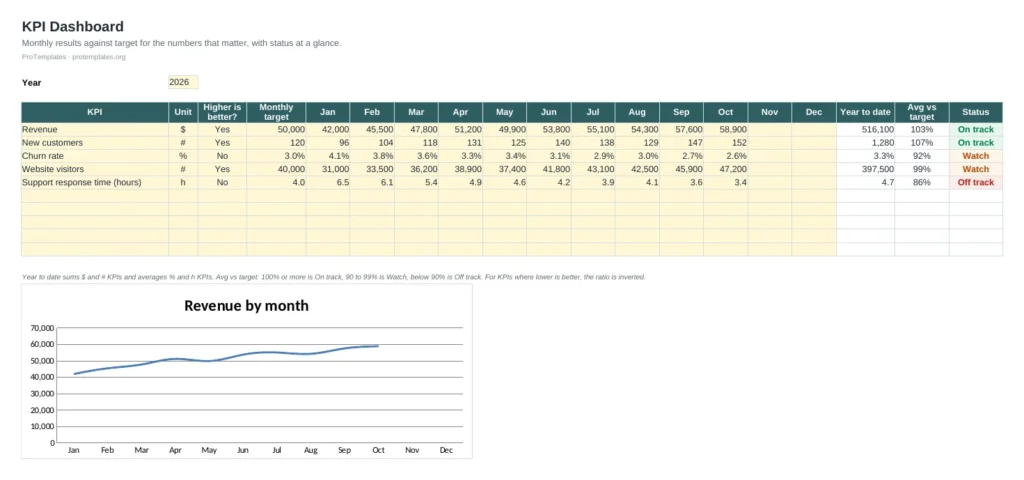
- Up to ten KPIs with unit, direction and monthly target
- Twelve monthly result columns
- Year-to-date and average against target
- Automatic On track, Watch or Off track status
- Line chart for the first KPI
How to use it
- List your KPIs with their unit, whether higher is better and the monthly target.
- Enter results as each month closes.
- Review the status column at your monthly meeting.
- Investigate any KPI in Watch or Off track.
FAQ
How many KPIs should I track?
Usually five to ten. More than that and the dashboard stops pointing to what matters.
How does it handle metrics where lower is better?
Mark the KPI as No in Higher is better; the comparison with target is inverted.
Can I change the status thresholds?
Yes. Edit the 100% and 90% values in the Status formula.